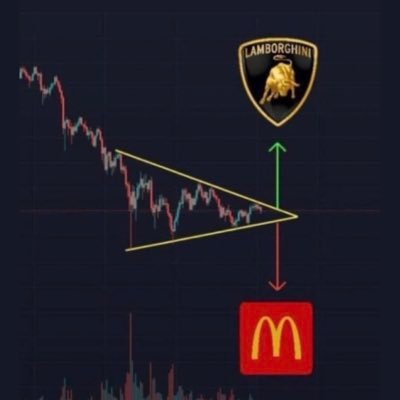
I don’t know how you showed up on my feed, but probably because I am expecting down by the end of September
$BTC - $SPX Correction Indicator (You're welcome in advance edition):
Here's another one of my trusty correction/crash indicators that I use to telegraph significant price declines in SPX, as BTC has proven to be the most reliable risk-on / risk-off indicator that exists for reading future equity market moves.
As shown here, areas shaded in gray are periods where BTC is declining while SPX is still rising, and areas in pink show the periods of SPX peak to trough declines that immediately followed. Each time this divergence occurred, SPX capitulated and dropped anywhere from 10%-35%. We`re currently in the exact same position and the daily is showing we`re within days to weeks before SPX should drop significantly yet again. But maybe this time is different, right? RIGHT?...(Spoiler: It's not).
Not advice, I eat crayons

1.39K
0
The content on this page is provided by third parties. Unless otherwise stated, OKX is not the author of the cited article(s) and does not claim any copyright in the materials. The content is provided for informational purposes only and does not represent the views of OKX. It is not intended to be an endorsement of any kind and should not be considered investment advice or a solicitation to buy or sell digital assets. To the extent generative AI is utilized to provide summaries or other information, such AI generated content may be inaccurate or inconsistent. Please read the linked article for more details and information. OKX is not responsible for content hosted on third party sites. Digital asset holdings, including stablecoins and NFTs, involve a high degree of risk and can fluctuate greatly. You should carefully consider whether trading or holding digital assets is suitable for you in light of your financial condition.


