Diese Seite dient nur zu Informationszwecken. Bestimmte Dienste und Funktionen sind in deinem Land möglicherweise nicht verfügbar.

How to Use Value at Risk (VaR) to Manage Your Cryptocurrency Assets

The crypto market is known for its extreme volatility, where the price of cryptocurrencies can vigorously fluctuate within a short period of time. In a market full of uncertainty, managing risks is therefore crucial for any traders, only by analyzing the possible risks of investments can traders determine the extent and occurrence ratio of potential losses in their portfolios.

To evaluate portfolio risk, we can make use of different tools in the market to calculate the “worse-case scenario” in trading, such as Value at Risk (VaR).

Understanding Value at Risk (VaR)

Dubbed the “new science of risk management”, Value at Risk (VaR) is a statistic that measures and quantifies the level of financial risk within a firm, a portfolio or a position over a specific time frame. It can be applied to measure the risk exposure of specific positions or whole portfolios.

A VAR statistic has three components: a time period, a confidence level and a loss amount (or loss percentage). Let’s look at an example of using VaR to calculate risks.

BTC/USDT: VaR Calculation

We will focus on the minute closing price of BTC/USDT between Aug 15–21, 2019 on OKX. This calculation assumes that log-returns are normally distributed.

Step 1: Calculate the minute log-returns

Minute log-returns can be calculated based on the below formula:

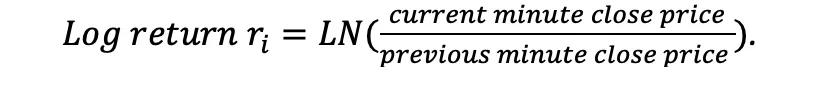
Here we use the logarithm of returns instead of price returns. The benefits of using log-returns, versus prices, is log-normality: assuming the prices are distributed log normally, the log return is conveniently normally distributed, which is handy given much of classic statistics presumes normality.

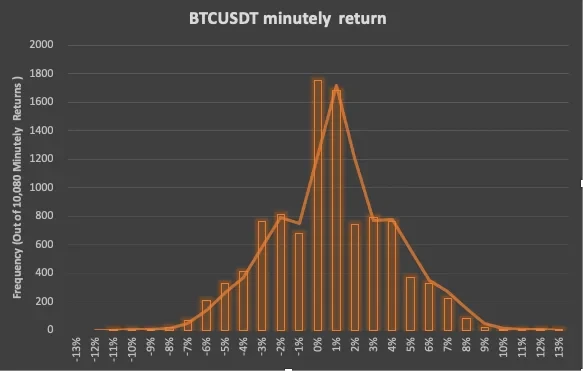
We can then divide the log-returns into 27 intervals: (-14%, -13%), (-12%, -11%), …, (12%, 13%), count the number of minute returns for each interval and we get the following histogram:

Step 2: Calculate the average and standard deviation of log returns

We can then calculate the average and standard deviation of log-returns based on the formulas:

The average (µ) of 10,080-minute log-returns turns out to be 0.001083%, and the standard deviation (σ) is 0.03170.

Step 3: Calculate VaR based on confidence intervals of normal distribution

Assuming the returns are normally distributed, we can see where do the worst 5% and 1% lie on the normal curve. They show trader’s desired confidence, the standard deviation and the average from the below table:

The Verdict

There are two ways to understand the VaR calculation results:

  • With 95% and 99% confidence, we can expect that the worst loss will not exceed 5.23% and 7.38% respectively;
  • If we invest $10,000, we are 95% and 99% confident that our worst minute-loss will not exceed $523 (=$10,000 x -5.23%) and $738 (=$10,000 x -7.38%) respectively.

VaR is useful for calculating the maximum expected loss on an investment over a given time and a specified degree of confidence. Traders can apply VaR to determine the level of risk or potential losses of their trading portfolios easily and hence take necessary measures to control the risks.

Haftungsausschluss
Dieser Inhalt dient nur zu Informationszwecken und kann sich auf Produkte beziehen, die in deiner Region nicht verfügbar sind. Dies stellt weder (i) eine Anlageberatung oder Anlageempfehlung noch (ii) ein Angebot oder eine Aufforderung zum Kauf, Verkauf oder Halten von digitalen Assets oder (iii) eine Finanz-, Buchhaltungs-, Rechts- oder Steuerberatung dar. Krypto- und digitale Asset-Guthaben, einschließlich Stablecoins, sind mit hohen Risiken verbunden und können starken Schwankungen unterliegen. Du solltest gut abwägen, ob der Handel und das Halten von digitalen Assets angesichts deiner finanziellen Situation sinnvoll ist. Bei Fragen zu deiner individuellen Situation wende dich bitte an deinen Rechts-/Steuer- oder Anlagenexperten. Informationen (einschließlich Marktdaten und ggf. statistischen Informationen) dienen lediglich zu allgemeinen Informationszwecken. Obwohl bei der Erstellung dieser Daten und Grafiken mit angemessener Sorgfalt vorgegangen wurde, wird keine Verantwortung oder Haftung für etwaige Tatsachenfehler oder hierin zum Ausdruck gebrachte Meinungen übernommen.

© 2025 OKX. Dieser Artikel darf in seiner Gesamtheit vervielfältigt oder verbreitet oder es dürfen Auszüge von 100 Wörtern oder weniger dieses Artikels verwendet werden, sofern eine solche Nutzung nicht kommerziell erfolgt. Bei jeder Vervielfältigung oder Verbreitung des gesamten Artikels muss auch deutlich angegeben werden: „Dieser Artikel ist © 2025 OKX und wird mit Genehmigung verwendet.“ Erlaubte Auszüge müssen den Namen des Artikels zitieren und eine Quellenangabe enthalten, z. B. „Artikelname, [Name des Autors, falls zutreffend], © 2025 OKX.“ Einige Inhalte können durch künstliche Intelligenz (KI) generiert oder unterstützt worden sein. Es sind keine abgeleiteten Werke oder andere Verwendungen dieses Artikels erlaubt.

Verwandte Artikel

Mehr anzeigen
Your money your choice
Technical analysis

Understanding the concept of an all-time high (ATH) in crypto

As the crypto market continues its powerful surge following the April 2024 Bitcoin halving, we’re witnessing breathtaking gains across a wide range of coins and tokens. The rally has reignited memories of past bull market frenzies, only this time, prices have already shattered previous records. Bitcoin, which set its former all-time high of around $68,742 on November 10, 2021, has since stormed past the $100,000 mark in late 2024 and reached over $123,000 in August 2025. With fear of missing out (FOMO) running high, traders are now asking not if the market can reclaim old highs, but how far this cycle can push the boundaries of what’s possible.
27. Aug. 2025
Anfänger(innen)
34
Bitcoin generic thumb
Bitcoin
Research

Comparing Bitcoin and S&P 500: charts and correlation to stocks

When it comes to building a portfolio for the long haul, traders often look towards long-standing, blue-chip stocks and exchange-traded funds tracking the Standard and Poor's 500 (S&P 500). Given their time-tested narrative and popularity among institutions, it's no surprise why such assets are top picks for anyone new to the world of traditional finance (TradFi).
27. Aug. 2025
Mittel
16
okx learn default
Strategies

What are Carry trades — profit from cash-and-carry arbitrage

A carry trade is a relatively low-risk strategy that enables traders to profit from price differences between spot and futures contracts, or between spot and perpetual-swap prices. When a futures cont
27. Aug. 2025
3
Generic charts thumbnail
Technical analysis

What Are Bollinger Bands and How To Use Them for Crypto Trading?

The Bollinger Band is a popular technical analysis tool used to measure volatility and identify potential price trends for various financial instruments, including cryptocurrencies. Developed by John
27. Aug. 2025
10
A Beginner’s Guide to Satoshi The Smallest Unit of Bitcoin
Bitcoin
Research
Strategies

Bitcoin vs gold: can digital gold beat its physical counterpart?

For centuries, gold has stood the test of time with little competition as an asset. To many, it’s the perfect asset. It's scarce and has become a sought-after metal. It’s long been a bastion of value and a hedge against economic turmoil. However, Bitcoin has challenged gold’s position in the last few years, leading some to call it “digital gold”.
27. Aug. 2025
Anfänger(innen)
17
Bitcoin generic thumb
Bitcoin
Technical analysis

A Beginner’s Guide To Bid Price, Ask Price, and Spread in Bitcoin Trading

One of the first concepts that an aspiring Bitcoin trader needs to understand is how trading actually works. In order to do so, it is highly important to understand trading terminology. More specifica
27. Aug. 2025
1
Mehr anzeigen